According to the Bureau of Labor Statistics (BLS), there are more than 240,000 physical therapists (PTs) throughout the United States.1 Whether you’re learning how to become a physical therapist (PT) or are a practicing PT, you may wonder what states offer the best physical therapist salary relative to their cost of living. Depending on your situation and future goals, the criteria of what makes a state the best for a physical therapist may vary.
Below, we review various metrics to help you see which states are ideal for physical therapists. We highlight the average physical therapy salary by state and list each state’s cost of living index and projected growth.
Table of Contents:
- What Do Physical Therapists Do?
- Key Findings
- Top 10 States for Physical Therapists
- Average Physical Therapist Salary by State
- Projected Job Growth for Physical Therapists by State
- Top-Paying Industries for Physical Therapists
- What Physical Therapists Treat
- Begin Your Physical Therapy Education Today
What Do Physical Therapists Do?
The primary job of a physical therapist is to help patients with injuries manage their pain and regain the range of motion in the injured area. Whether the injured area gets back to 100% or not, physical therapists help patients improve their quality of life.
Physical therapists work in various settings, including:
- Hospitals
- Schools
- Outpatient clinics
- Inpatient rehabilitation facilities
- Sports and fitness facilities
- Private practices
As a physical therapist, you’re there to listen to patients, address their concerns and help diagnose issues by monitoring their movements. By understanding the patient’s goals, you can help provide them with exercises and stretching to help get them back to the activities they enjoy.
Key Findings
Physical therapy salary is important, but it’s one factor in identifying the best states for physical therapists. When looking at multiple data points, here are some key findings:
- California pays the most, with an average physical therapy salary of $114,270.1
- The job outlook for physical therapists in Arizona is bright. The state has the highest projected growth for physical therapist jobs: 52% by 2030.2
- The metropolitan area with the highest concentration of physical therapists is Homosassa Springs, FL, with 3.87 physical therapists per 1,000 jobs.1
- The highest-paying industry for PTs is at outpatient care centers, with an average physical therapy salary of $123,900.1
10 Best States for Physical Therapists
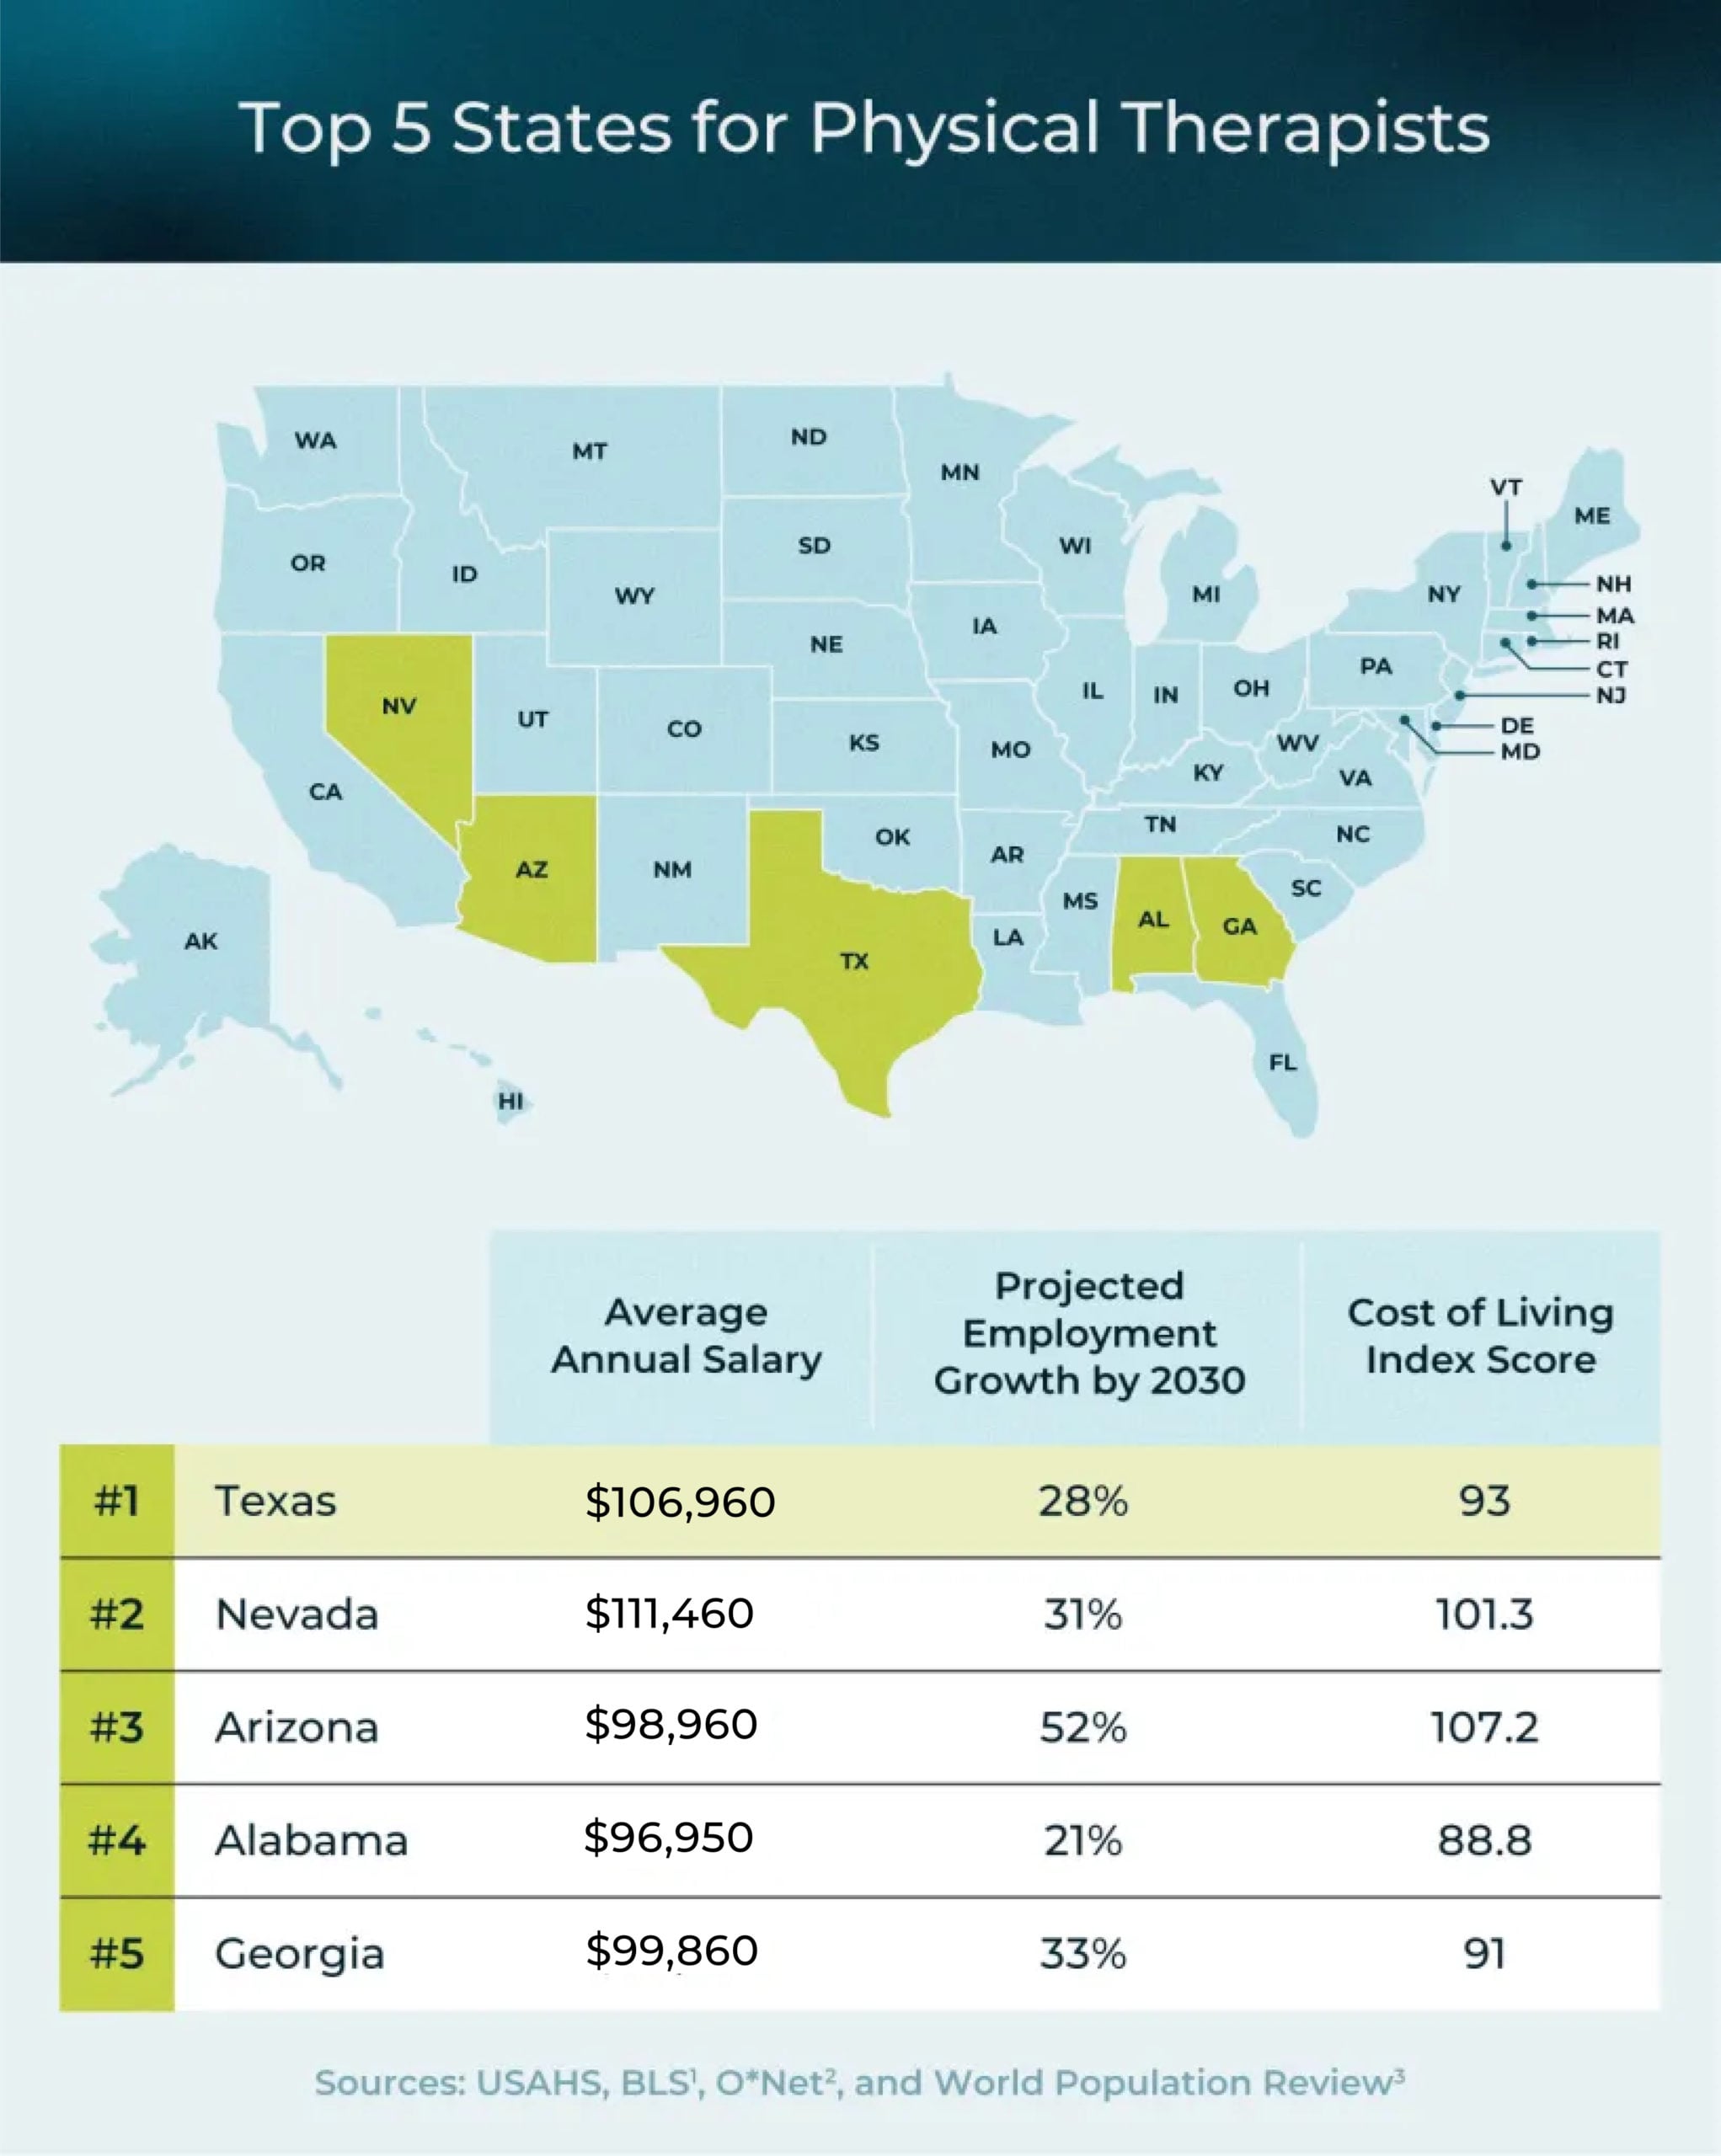
The following rankings include states with the highest average physical therapy salary and also consider the cost of living and expected employment growth. Of the top states, Texas has a projected employment growth of 28% by 2030 and an average physical therapy salary of $106,960. The national average PT salary is $100,440.1,2
Nevada is on the list due to a high average physical therapist salary of $111,460, the highest in our top 10 list. Meanwhile, Arizona has the highest projected employment growth for PTs at 52% and an average physical therapy salary of $98,960.2, 1 Arizona also has one of the highest costs of living in the top 10, along with New Jersey, Nevada and Colorado.3
Looking at physical therapy salary, projected employment growth and cost of living index score, here’s a breakdown of the top 10 states for physical therapists:
| State | Average Annual Salary1 | Projected Employment Growth by 20302 | Cost of Living Index Score3 |
|---|---|---|---|
| Texas | $106,960 | 28% | 93 |
| Nevada | $111,460 | 31% | 101.3 |
| Arizona | $98,960 | 52% | 107.2 |
| Alabama | $96,950 | 21% | 88.8 |
| Georgia | $99,860 | 33% | 91 |
| Mississippi | $95,230 | 23% | 85.3 |
| Colorado | $98,000 | 37% | 105.5 |
| West Virginia | $94,130 | 35% | 90.3 |
| New Jersey | $109,280 | 24% | 114.1 |
| Pennsylvania | $98,970 | 20% | 99 |
The 5 Worst States for Physical Therapists
It’s helpful to know the worst states for physical therapists. The worst states have a combination of low average salaries, high cost of living and a low projection for employment growth. Among the worst states on the list is Maine, with an annual average physical therapist salary of $91,720 and placed in the top 20 for the highest cost of living.
| State | Average Annual Salary1 | Projected Employment Growth by 20302 | Cost of Living Index Score3 |
|---|---|---|---|
| Maine | $91,720 | 9% | 111.5 |
| Montana | $85,550 | 16% | 103.7 |
| Maryland | $105,520 | 18% | 119.5 |
| Minnesota | $97,860 | 14% | 94.1 |
| New Hampshire | $95,220 | 20% | 115 |
Average Physical Therapist Salary by State
If you’re looking for the highest compensation, look at the highest-paying states for physical therapy. One of the best metrics you can look at is mean annual wage, or average.4 The state with the highest mean annual physical therapist salary is California, at $114,270, with Nevada and Alaska coming in second and third at $111,460 and $110,830, respectively.1
| State | 2023 Annual Mean Salary Range1 |
|---|---|
| California | $100,810 – $114,270 |
| Nevada | $100,810 – $114,270 |
| New Jersey | $100,810 – $114,270 |
| Alaska | $100,810 – $114,270 |
| Connecticut | $100,810 – $114,270 |
| New York | $100,810 – $114,270 |
| Texas | $100,810 – $114,270 |
| Washington | $100,810 – $114,270 |
| Hawaii | $100,810 – $114,270 |
| Illinois | $100,810 – $114,270 |
| Delaware | $100,810 – $114,270 |
| Maryland | $100,810 – $114,270 |
| Washington, D.C. | $100,810 – $114,270 |
| Arizona | $96,860 – $100,310 |
| Pennsylvania | $96,860 – $100,310 |
| Alabama | $96,860 – $100,310 |
| Virginia | $96,860 – $100,310 |
| Georgia | $96,860 – $100,310 |
| Ohio | $96,860 – $100,310 |
| Minnesota | $96,860 – $100,310 |
| Utah | $96,860 – $100,310 |
| Colorado | $96,860 – $100,310 |
| Oregon | $96,860 – $100,310 |
| Louisiana | $96,860 – $100,310 |
| Massachusetts | $96,860 – $100,310 |
| New Mexico | $96,860 – $100,310 |
| Mississippi | $94,130 – $96,760 |
| Rhode Island | $94,130 – $96,760 |
| Wisconsin | $94,130 – $96,760 |
| Vermont | $94,130 – $96,760 |
| West Virginia | $94,130 – $96,760 |
| Indiana | $94,130 – $96,760 |
| North Carolina | $94,130 – $96,760 |
| Michigan | $94,130 – $96,760 |
| South Carolina | $94,130 – $96,760 |
| Florida | $94,130 – $96,760 |
| Tennessee | $94,130 – $96,760 |
| Oklahoma | $94,130 – $96,760 |
| New Hampshire | $94,130 – $96,760 |
| Wyoming | $52,690 – $93,780 |
| Missouri | $52,690 – $93,780 |
| Idaho | $52,690 – $93,780 |
| Nebraska | $52,690 – $93,780 |
| Kansas | $52,690 – $93,780 |
| Iowa | $52,690 – $93,780 |
| South Dakota | $52,690 – $93,780 |
| Maine | $52,690 – $93,780 |
| Kentucky | $52,690 – $93,780 |
| Montana | $52,690 – $93,780 |
| North Dakota | $52,690 – $93,780 |
Projected Job Growth for Physical Therapists by State
Before choosing which state is best to pursue your PT career, it’s beneficial to understand the physical therapist job outlook in each state. O*Net highlights job growth for specific industries so you can assess how much the job market for physical therapists may grow by 2030.2 Arizona expects to see a 52% growth by 2030, and states like Colorado, Washington and West Virginia have an expected job growth of 35% or more in the coming years.2
| State | Projected Employment Growth2 |
|---|---|
| Arizona | 52% |
| Colorado | 37% |
| Washington | 35% |
| West Virginia | 35% |
| Georgia | 33% |
| Nevada | 31% |
| Utah | 31% |
| New York | 28% |
| Texas | 28% |
| Iowa | 27% |
| Hawaii | 26% |
| Wyoming | 26% |
| Delaware | 25% |
| Florida | 25% |
| Oklahoma | 25% |
| Idaho | 24% |
| New Jersey | 24% |
| New Mexico | 24% |
| North Dakota | 24% |
| Oregon | 24% |
| South Carolina | 24% |
| Arkansas | 23% |
| Massachusetts | 23% |
| Mississippi | 23% |
| Vermont | 23% |
| Nebraska | 22% |
| Alabama | 21% |
| Kentucky | 21% |
| North Carolina | 21% |
| Indiana | 20% |
| New Hampshire | 20% |
| Pennsylvania | 20% |
| Washington D.C. | 20% |
| California | 19% |
| Michigan | 19% |
| South Dakota | 19% |
| Virginia | 19% |
| Maryland | 18% |
| Tennessee | 18% |
| Missouri | 17% |
| Montana | 16% |
| Rhode Island | 16% |
| Alaska | 15% |
| Kansas | 15% |
| Connecticut | 14% |
| Minnesota | 14% |
| Ohio | 14% |
| Wisconsin | 11% |
| Illinois | 10% |
| Louisiana | 10% |
| Maine | 9% |
The Top 5 States with the Highest Employment Levels
Projected growth is good information. You also want to know where physical therapists work. A state with fewer physical therapists and high projected growth may indicate a good state for work. However, if the job market is saturated with low projected growth, perhaps consider another state.
The following data is from BLS:
| State | Number of Employed Physical Therapists1 | Employment Per Thousand Jobs1 |
|---|---|---|
| California | 24,200 | 1.35 |
| Texas | 17,170 | 1.27 |
| Florida | 16,150 | 1.69 |
| New York | 15,560 | 1.66 |
| Pennsylvania | 11,780 | 1.98 |
The Top 5 Cities with the Highest Concentration of Employment
| Metropolitan Area | Number of Employed Physical Therapists1 | Employment Per Thousand Jobs1 |
|---|---|---|
| Homosassa Springs, FL | 130 | 3.87 |
| Las Cruces, NM | 270 | 3.57 |
| Bloomsburg-Berwick, PA | 140 | 3.38 |
| Rochester, MN | 400 | 3.32 |
| Jonesboro, AR | 190 | 3.18 |
Top-Paying Industries for Physical Therapists
There are a range of industries for physical therapists, and the characteristics of a good physical therapist are beneficial for each of them. Each industry pays a different physical therapist salary by state, and this list shows which pays the most on average across the country. The industry that pays the most is outpatient care centers, but you can also make a decent wage in an educational role for physical therapists.1
| Industry | Annual Mean Salary1 |
|---|---|
| Outpatient Care Centers | $123,900 |
| Home Health Care Services | $116,500 |
| Educational Support Services | $112,270 |
| Management of Companies and Enterprises | $111,950 |
| Individual and Family Services | $108,950 |
What Physical Therapists Treat
What you treat as a physical therapist may vary, but regardless of which state you live in, here are some of the common conditions PTs treat:5
- Sports-related injuries
- Skin conditions and injuries like burns
- Cardiopulmonary conditions
- Hand conditions like carpal tunnel syndrome
- Musculoskeletal dysfunction

Begin Your Physical Therapy Education Today
If you’re looking for a career in physical therapy, start with a quality education. USAHS has over 40 years of experience as a physical therapy school and an extensive alumni network. Our programs can take between 2.3 and three years to complete.* We have Residential, Hybrid Immersion**, and Flex Doctor of Physical Therapy (DPT) pathways that incorporate online and in-person learning to fit your lifestyle. To learn more about our program, request information today.
*Time to completion may vary by student, depending on individual progress, credits transferred and other factors.
**The University of St. Augustine for Health Sciences (USAHS) is seeking approval from the Commission on Accreditation in Physical Therapy Education (CAPTE) for an expansion of its Doctor of Physical Therapy (DPT) program at its San Marcos, CA, and Miami, FL, campuses with a Hybrid Immersion model. Approval of the expansion programs is required prior to implementation.
Applicants interested in the Hybrid Immersion DPT format should contact an enrollment advisor using the request for information form on our site.
Salary data may not reflect starting pay for recent graduates.
Sources
- U.S. Bureau of Labor Statistics, “Occupational Employment and Wage Statistics,”BLS, April 3, 2024, https://www.bls.gov/oes/current/oes291123.htm.
- O*NET OnLine, “29-1123.00 – Physical Therapists,” O*NET OnLine, May 21, 2024, https://www.onetonline.org/link/localtrends/29-1123.00?st=.
- World Population Review, “Cost of Living Index by State 2024,” World Population Review, 2024, https://worldpopulationreview.com/state-rankings/cost-of-living-index-by-state.
- Diffen, “Mean vs. Median,” Diffen LLC, June 6, 2024, https://www.diffen.com/difference/Mean_vs_Median.
- Lori Smith, “How Does Physical Therapy Help?” Medical News Today, January 11, 2024, https://www.medicalnewstoday.com/articles/160645#common-conditions.