The DPT integrated curriculum is delivered in 7 trimesters for the Residential pathway and 9 trimesters for Flex. The Hybrid Immersion pathway will be delivered in 7 trimesters. Highlights include: innovative immersive lab experiences where students integrate and apply learnings from coursework to refine clinical skills, clinical simulations, pro bono clinical experiences and faculty mentoring. A newly designed Integrated Foundational Science course covers anatomy, physiology, neuroscience and biomechanics. Students can choose from electives in Sports Therapy, Neurology, Pelvic Health, Manual Therapy, and Business Leadership, enabling them to develop specialized skills and earn micro-credentials that enhance their career opportunities. For the Hybrid Immersion pathway, there are a total of 9 on-campus immersive learning experiences that will take place in trimesters 1-4. There are three on-campus learning experiences in trimester 1 and two on-campus learning experiences in trimesters 2, 3 and 4. For the Flex pathway, there are 7-9 on-campus immersive learning experiences each term that take place in trimesters 1-6.
Residential DPT (San Marcos, CA; St. Augustine and Miami, FL; Austin, TX; Dallas, TX) and
Hybrid Immersion DPT (San Marcos, CA; Miami, FL; Dallas, TX) Curriculum
| TRIMESTER I | |
| Full Trimester Courses: 12 credits (Term A) | |
| PHT 5162C - Health Promotion, Fitness & Wellness (2 credits) | |
| PHT 5161 - Professional Formation I (2) | |
| PHT 5166C - Integrated Clinical Lab I (2) | |
| PHT 5117C - Integrated Foundational Sciences I (6) | |
| 1st Half Trimester I: 3 Credits (Subterm D) | 2nd Half Trimester I: 3 Credits (Subterm E) |
| PHT 5128 - Teaching & Learning In Physical Therapy (1) | PHT 5151 - Societal Health & Healthcare Systems (1) |
| PHT 5139 - Fundamentals of Physical Therapy (2) | PHT 5156 - Evidence Informed Practice (2) |
| Total Trimester Credits: 18 | |
| TRIMESTER II | |
| Full Trimester Courses: 7 credits (Term A) | |
| PHT 5262 - Professional Formation II (1) | |
| PHT 5266C - Integrated Clinical Lab II (2) | |
| PHT 5211C - Physical Therapy Tests and Measures (2) | |
| PHT 5222C - Physical Therapy Examination Across Clinical Settings (2) | |
| 1st Half Trimester II: 6 Credits (Subterm D) | 2nd Half Trimester II: 6 Credits (Subterm E) |
| PHT 5237 - Medical Screening & Pathology I (2) | PHT 5247 - Medical Screening & Pathology II (2) |
| PHT 5203 - Clinical Reasoning & Communication (1) | PHT 5244 - Innovation & Technology (1) |
| PHT 5216 - Biophysical Agents (1) | PHT 5249C - Exercise Science & Prescription (3) |
| PHT 5228 - Science of Movement (2) | |
| Total Trimester II Credits: 19 | |
| TRIMESTER III | |
| Full Trimester Courses: 5 credits (Term A) | |
| PHT 5303 - Integumentary (1) | |
| PHT 5342 - Clinical Reasoning & Decision Making I (1) | |
| PHT 5363 - Professional Formation III (1) | |
| PHT 5366C - Integrated Clinical Lab III (2) | |
| 1st Half Trimester III: 6 Credits (Subterm D) | 2nd Half Trimester III: 6 Credits (Subterm E) |
| PHT 5311C - Neuromuscular I (2) | PHT 5302C - Neuromuscular II (2) |
| PHT 5321C - Musculoskeletal I (2) | PHT 5322C - Musculoskeletal II (2) |
| PHT 5332C - Cardiovascular & Pulmonary I (2) | PHT 5341C - Cardiovascular & Pulmonary II (2) |
| Total Trimester III Credits: 17 | |
| TRIMESTER IV | |
| Full Trimester Courses: 4 credits (Term A) | |
| PHT 5442 - Clinical Reasoning & Decision Making II (1) | |
| PHT 5464 - Professional Formation IV (1) | |
| PHT 5466C - Integrated Clinical Lab IV (2) | |
| 1st Half Trimester IV: 8 Credits (Subterm D) | 2nd Half Trimester IV: 8 Credits (Subterm E) |
| PHT 5419C - Physical Therapy Across the Lifespan: Pediatrics (2) | PHT 5434C - Physical Therapy Across the Lifespan: Older Adult (2) |
| PHT 5428C - Acute Care Physical Therapy (2) | PHT 5447C - Prosthetics & Orthotics (2) |
| PHT 5403C - Musculoskeletal III (2) | PHT 5404C - Musculoskeletal IV (2) |
| PHT 5423C - Neuromuscular III (2) | PHT 5424C - Neuromuscular IV (2) |
| Total Trimester IV Credits: 20 | |
| Trimester V starts with coursework and ends with a 12-week clinical experience | |
| PHT 5540 - Terminal Clinical I (10)* | |
| PHT 5526 - Humanities in Healthcare (2) | |
| Total Trimester V Credits: 12 | |
| Trimester VI starts with a 10-week clinical experience and ends with coursework | |
| Term A | |
| PHT 5640 - Terminal Clinical II (8)* | |
| Subterm E | |
| PHT 5655 - Professional Formation V (1) | |
| PHT 5617 - Frontiers in Rehabilitation (2) | |
| Elective 1** | |
| Total Trimester VI Credits: 12 | |
| Trimester VII starts with a 10-week clinical experience and ends with coursework | |
| Term A | |
| PHT 5740 - Terminal Clinical III -10 weeks (8)* | |
| Subterm E | |
| PHT 5766 - Professional Formation VI (2) | |
| Elective 2 | |
| Elective 3 | |
| Total Trimester VII Credits: 12 | |
| Total Program Credits: 110 | |
**Note – Students are required to take 1 elective course in Trimester 6 and 2 elective courses in Trimester 7; elective offerings will cover topics in Sports Therapy, Neurology, Pelvic Health, Manual Therapy, and Business Leadership.
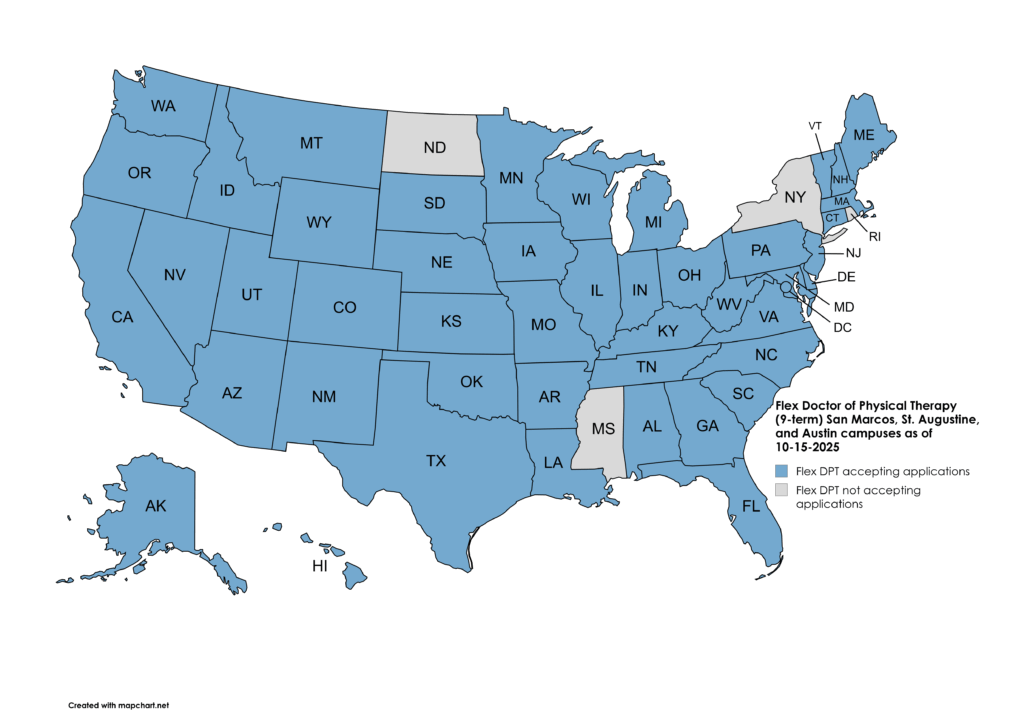
Flex DPT (San Marcos, CA; St. Augustine, FL and Austin, TX) Curriculum
| TRIMESTER I | |
| Full Trimester Courses: 10 credits (Term A) | |
| PHT 5162C - Health Promotion, Fitness & Wellness (2 credits) | |
| PHT 5159 - Professional Formation IA (1) | |
| PHT 5164C - Integrated Clinical Lab I X (1) | |
| PHT 5117C - Integrated Foundational Sciences (6) | |
| 1st Half Trimester I: 1 Credits (Subterm D) | 2nd Half Trimester I: 2 Credits (Subterm E) |
| PHT 5128 - Teaching & Learning in Physical Therapy (1) | PHT 5139 - Fundamentals of Physical Therapy (2) |
| Total Trimester Credits: 13 | |
| TRIMESTER II | |
| Full Trimester Courses: 7 credits (Term A) | |
| PHT 5211C - Physical Therapy Tests and Measures (2) | |
| PHT 5237 - Medical Screening & Pathology I (2) | |
| PHT 5259 - Professional Formation IB (1) | |
| PHT 5264C - Integrated Clinical Lab II X (2) | |
| 1st Half Trimester II: 3 Credits (Subterm D) | 2nd Half Trimester II: 4 Credits (Subterm E) |
| PHT 5203 - Clinical Reasoning & Communication (1) | PHT 5249C - Exercise Science & Prescription (3) |
| PHT 5228 - Science of Movement (2) | PHT 5151 - Societal Health & Healthcare Systems (1) |
| Total Trimester II Credits: 14 | |
| TRIMESTER III | |
| Full Trimester Courses: 7 credits (Term A) | |
| PHT 5222C - Physical Therapy Examination Across Clinical Settings (2) | |
| PHT 5247 - Medical Screening & Pathology II (2) | |
| PHT 5262 - Professional Formation II (1) | |
| PHT 5364C - Integrated Clinical Lab III II X (2) | |
| 1st Half Trimester III: 4 Credits (Subterm D) | 2nd Half Trimester III: 3 Credits (Subterm E) |
| PHT 5156 - Evidence Informed Practice (2) | PHT 5244 - Innovation & Technology (1) |
| PHT 5332C - Cardiovascular & Pulmonary I (2) | PHT 5341C - Cardiovascular & Pulmonary II (2) |
| Total Trimester III Credits: 14 | |
| TRIMESTER IV | |
| Full Trimester Courses: 2 credits (Term A) | |
| PHT 5342 - Clinical Reasoning & Decision Making I (1) | |
| PHT 5467C - Integrated Clinical Lab IV X (1) | |
| 1st Half Trimester IV: 5 Credits (Subterm D) | 2nd Half Trimester IV: 4 Credits (Subterm E) |
| PHT 5216 - Biophysical Agents (1) | PHT 5320C - Neuromuscular II (2) |
| PHT 5311C - Neuromuscular I (2) | PHT 5322C - Musculoskeletal II (2) |
| PHT 5321C - Musculoskeletal I (2) | |
| Total Trimester IV Credits: 11 | |
| TRIMESTER V | |
| Full Trimester Courses: 4 credits (Term A) | |
| PHT 5442 - Clinical Reasoning & Decision Making II (1) | |
| PHT 5303 - Integumentary (1) | |
| PHT 5363 - Professional Formation III (1) | |
| PHT 5564C - Integrated Clinical Lab V X (1) | |
| 1st Half Trimester V: 4 Credits (Subterm D) | 2nd Half Trimester V: 4 Credits (Subterm E) |
| PHT 5403C - Musculoskeletal III (2) | PHT 5404C - Musculoskeletal IV (2) |
| PHT 5423C - Neuromuscular III (2) | PHT 5424C - Neuromuscular IV (2) |
| Total Trimester V Credits: 12 | |
| TRIMESTER VI | |
| Full Trimester Courses: 2 credits (Term A) | |
| PHT 5464 - Professional Formation IV (1) | |
| PHT 5664C - Integrated Clinical Lab VI X (1) | |
| 1st Half Trimester VI: 4 Credits (Subterm D) | 2nd Half Trimester VI: 4 Credits (Subterm E) |
| PHT 5419C - Physical Therapy Across the Lifespan: Pediatrics (2) | PHT 5434C - Physical Therapy Across the Lifespan: Older Adult (2) |
| PHT 5428C - Acute Care Physical Therapy (2) | PHT 5447C - Prosthetics & Orthotics (2) |
| Total Trimester VI Credits: 10 | |
| TRIMESTER VII - Term VII Flex starts with coursework and ends with a 12-week clinical experience | |
| Term A | |
| PHT 5540 - Terminal Clinical I* (10) | |
| Subterm D | |
| PHT 5526 - Humanities in Healthcare (2) | |
| Total Trimester VII Credits: 12 | |
| Trimester VIII - Term VIII Flex starts with a 10-week clinical experience and ends with coursework | |
| Term A | |
| PHT 5640 - Terminal Clinical II* (8) | |
| Subterm E | |
| PHT 5655 - Professional Formation V (1) | |
| PHT 5617 - Frontiers in Rehabilitation (2) | |
| Elective 1** | |
| Total Trimester VIII Credits: 12 | |
| TRIMESTER IX Term IX Flex starts with a 10-week clinical experience and ends with coursework | |
| Term A | |
| PHT 5740 - Terminal Clinical III* (8) | |
| Subterm E | |
| PHT 5766 - Professional Formation VI (2) | |
| Elective 2 | |
| Elective 3 | |
| Total Trimester IX Credits: 12 | |
| Total Program Credits: 110 | |
**Note – Students are required to take 1 elective course in Trimester 8 and 2 elective courses in Trimester 9; elective offerings will cover topics in Sports Therapy, Neurology, Pelvic Health, Manual Therapy, and Business Leadership.