As a licensed physical therapist (PT), you’ll likely find that you’re not limited to working in one specific patient care office or rehab clinic. Once you complete a Doctor of Physical Therapy (DPT) degree with a CAPTE accredited degree program in the United States and pass the NPTE, you can apply for a license in any state and discover jobs in a wide range of practice types.
What can you do with a DPT degree? As a PT, you can pair your interest in helping patients achieve comfort, mobility and strength with exciting opportunities for growth and adventure.
Where can physical therapists work? Consider launching your career in a new city and high-paying location.
Where Do Physical Therapists Work?
The good news is that you can find PT jobs across the country.
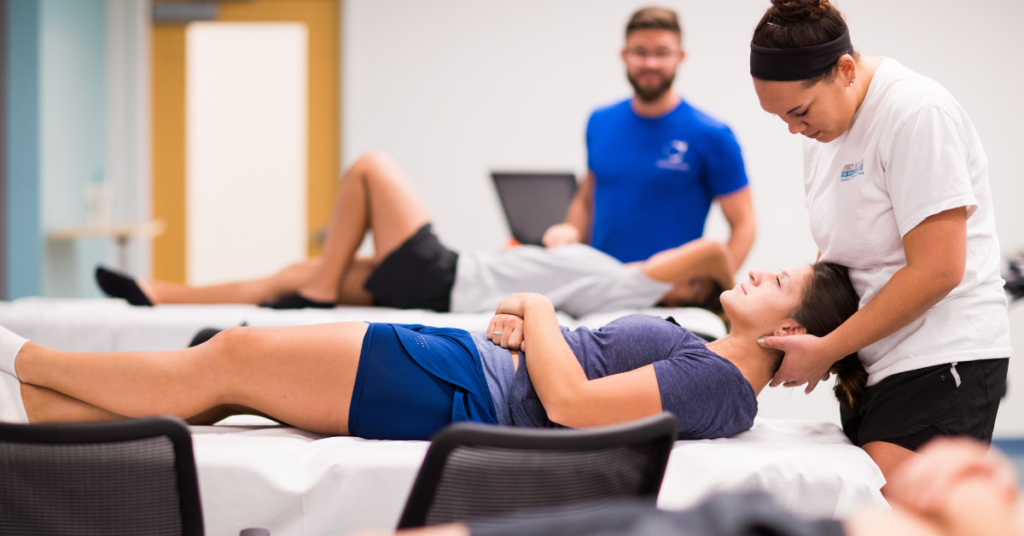
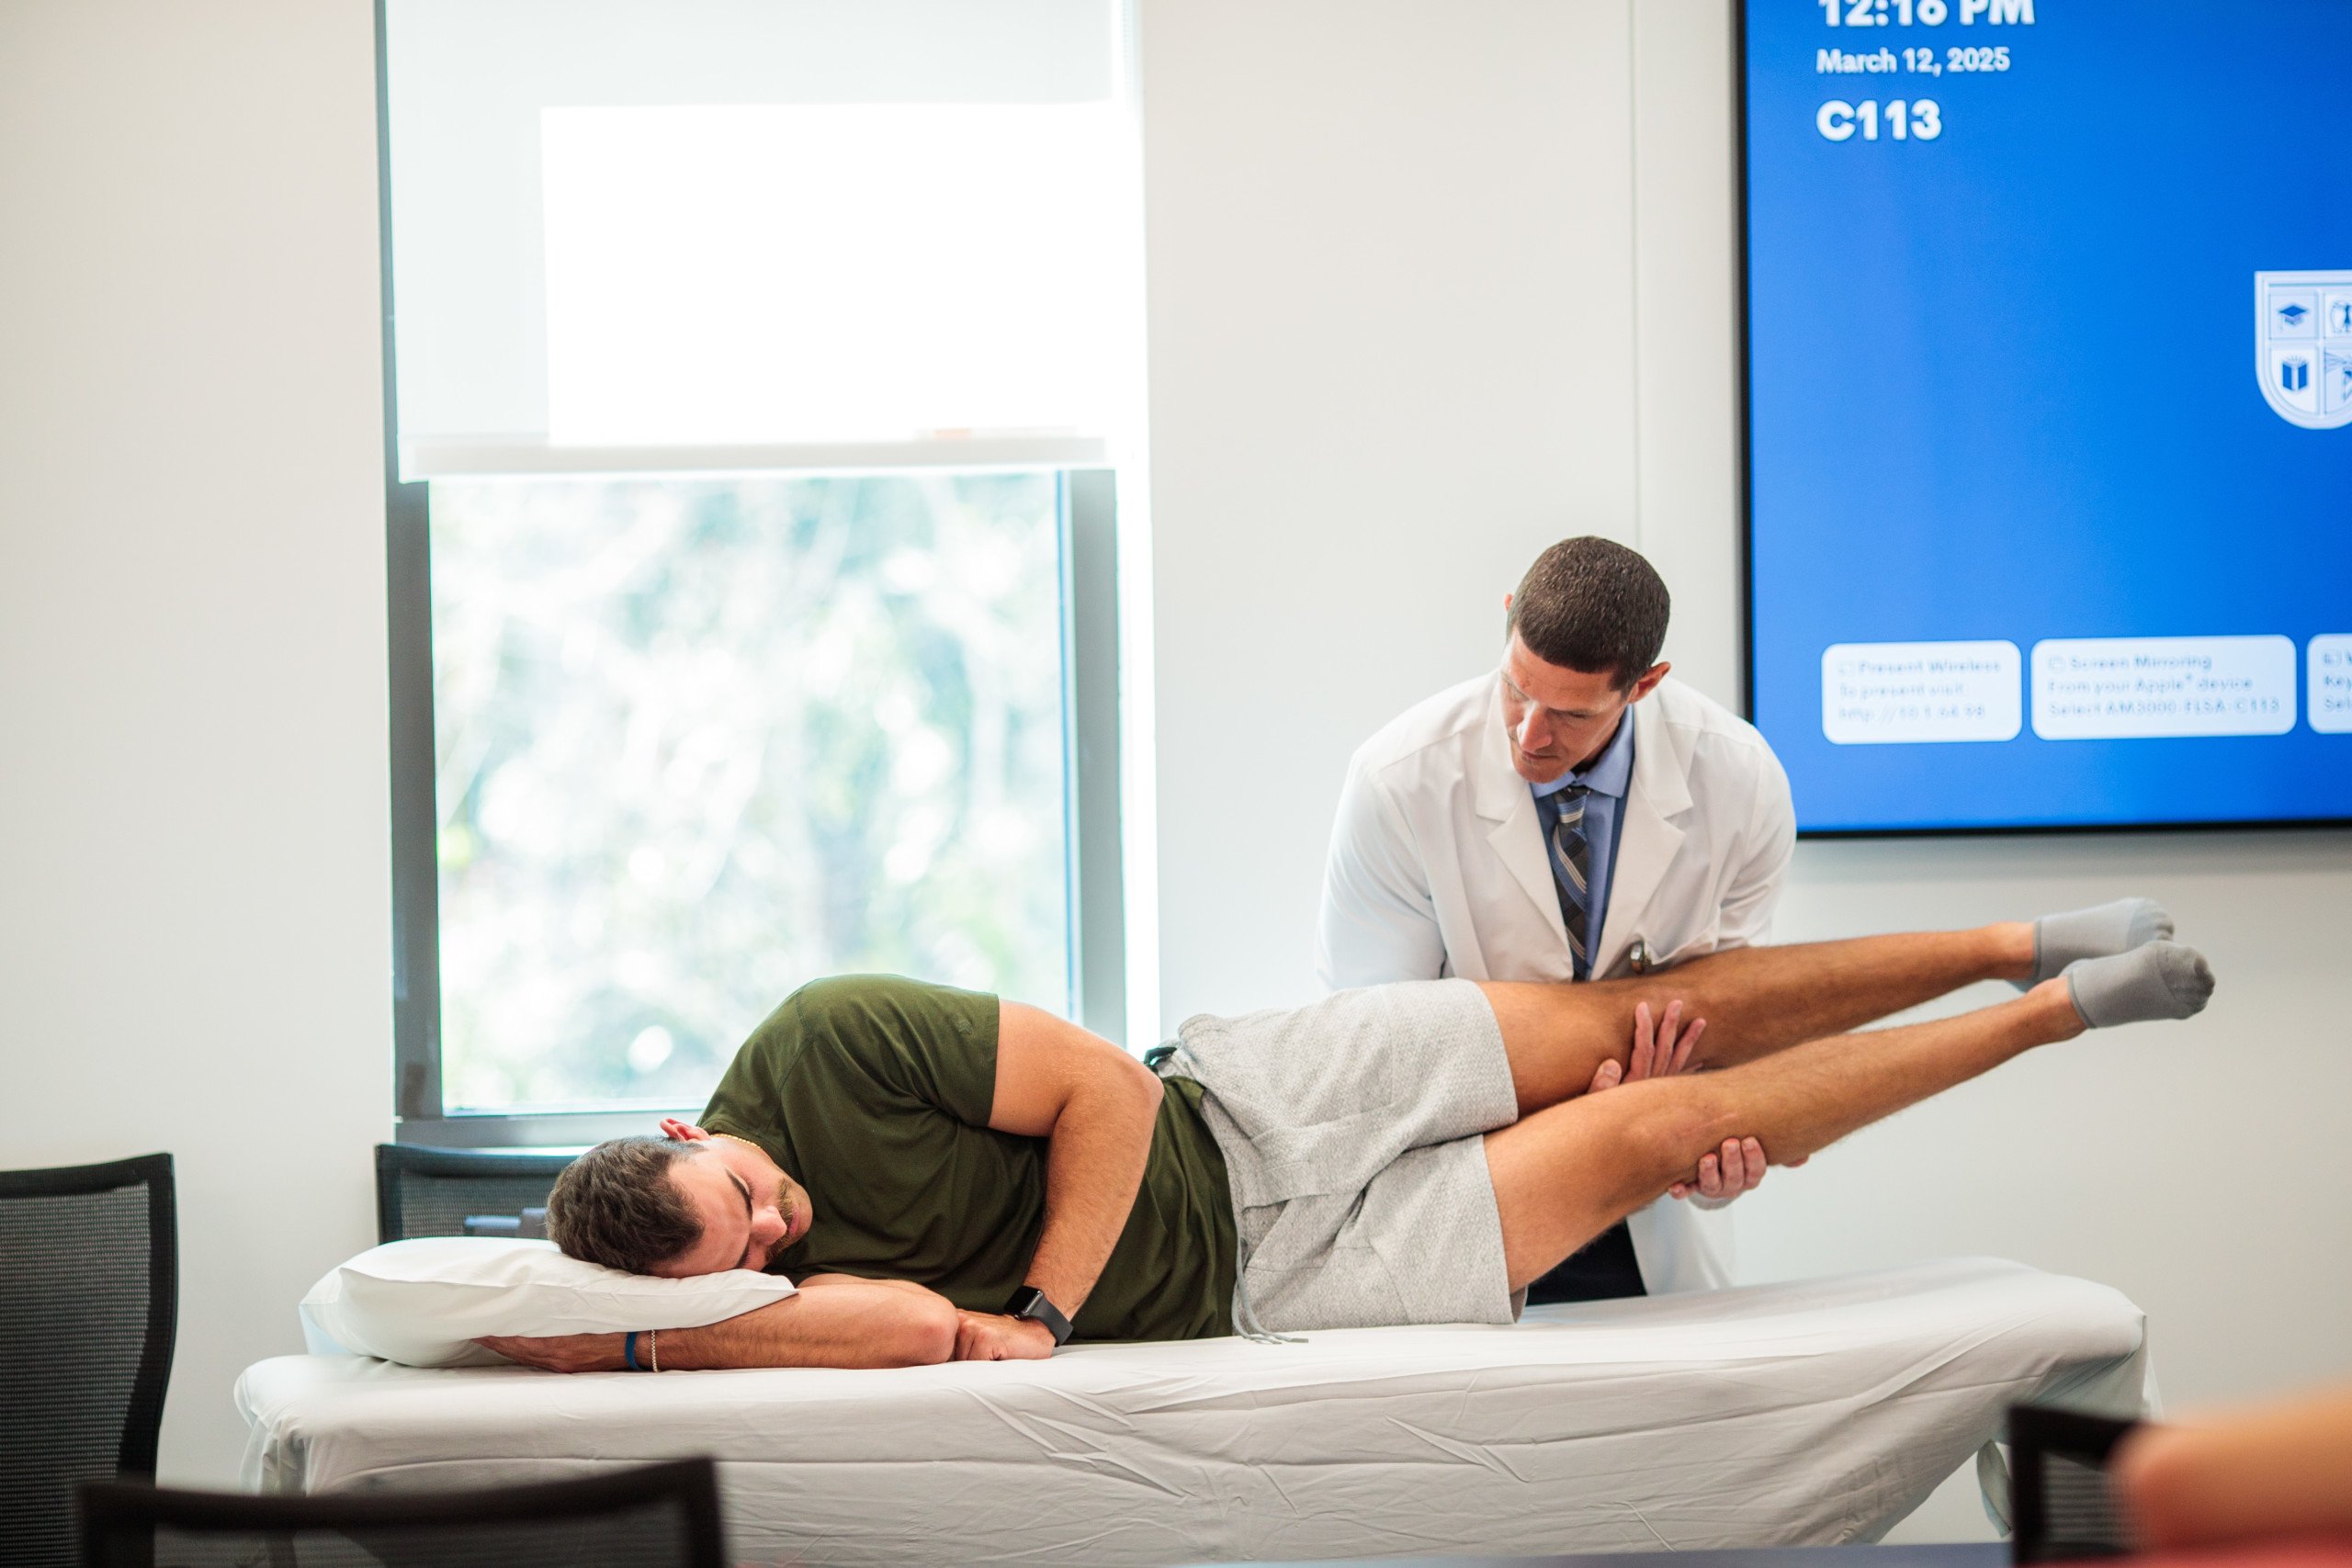
Physical therapy patients span all ages, injuries and conditions. Where can physical therapists work? They can find jobs in private clinics, hospitals, nursing homes and patients’ homes.1
Locations with the Most Physical Therapy Jobs
There are cities and states with more places of employment for physical therapists.
Physical Therapy Job Openings, by State
If you’re looking for the most PT job openings, consider the following top five states with the following number of jobs:2
- California: 24,200
- Texas: 17,170
- Florida: 16,150
- New York: 15,560
- Pennsylvania: 11,780
Best Cities for Physical Therapists in Terms of Employment Levels
The metropolitan areas with the following number of jobs and highest employment level for PTs are:2
- New York-Newark-Jersey City, NY-NJ-PA: 16,160
- Los Angeles-Long Beach-Anaheim, CA: 9,120
- Chicago-Naperville-Elgin, IL-IN-WI: 8,8700
- Philadelphia-Camden-Wilmington, PA-NJ-DE-MD: 5,940
- Miami-Fort Lauderdale-West Palm Beach, FL: 5,430
- Boston-Cambridge-Nashua, MA-NH: 5,270
- Washington-Arlington-Alexandria, DC-VA-MD-WV: 4,490
- Dallas-Fort Worth-Arlington, TX: 4,290
- Houston-The Woodlands-Sugar Land, TX: 3,650
- Atlanta-Sandy Springs-Roswell, GA: 3,420
Other Places of Employment for a Physical Therapist
Nonmetropolitan possible places of employment for a physical therapist with the following number of jobs and highest employment levels are:2
- Kansas: 490
- Southwest Maine: 450
- North Northeastern Ohio: 440
- Southern Pennsylvania: 430
- Northeast Mississippi: 420
Many of these physical therapist places of employment reflect the size and population of the locations—there aren’t necessarily more open positions per applicant there than in more sparsely populated locations.
Geographic Opportunity by Location Quotient
If you’re looking specifically for states with a higher-than-average level of employment in relation to their size and population, consider the location quotient rather than the total number of jobs. Location quotient measures the concentration of jobs in a population compared to the national average.
The top five states for where physical therapists can work based on this marker are:2
- Rhode Island: 1.6x the national average (1,240 jobs)
- Montana: 1.52x the national average (1,210 jobs)
- Maine: 1.47x the national average (1,450 jobs)
- Connecticut: 1.44x the national average (3,790 jobs)
- Delaware: 1.42x the national average (1,060 jobs)
The best cities for physical therapists based on the highest concentration of jobs and location quotients are:2
- Homosassa Springs, FL: 2.44x the national average (130 jobs)
- Las Cruces, NM: 2.25x the national average (270 jobs)
- Bloomsburg-Berwick, PA: 2.13x the national average (140 jobs)
- Rochester, MN: 2.09x the national average (400 jobs)
- Jonesboro, AR: 2.00x the national average (190 jobs)
- Victoria, TX: 1.92x the national average (120 jobs)
- Missoula, MT: 1.81x the national average (180 jobs)
- Altoona, PA: 1.79x the national average (160 jobs)
- Gadsden, AL: 1.79x the national average (90 jobs)
- Corvallis, OR: 1.78x the national average (110 jobs)
Nonmetropolitan places of employment for a physical therapist with the highest concentration of jobs and location quotients are:2
- Connecticut: 2.37x the national average (130 jobs)
- West Montana: 1.81x the national average (240 jobs)
- Southwest Colorado: 1.63x the national average (270 jobs)
- Southwest Montana: 1.61x the national average (380 jobs)
- North Arkansas: 1.51x the national average (280 jobs)
Why are there more physical therapy specialties in these locations? Consider each state and its population. For instance, Maine, Florida, Vermont and West Virginia have the highest percentage of populations of 65 and older.3Physical therapists facilitate physical therapy and rehabilitation for patients of all ages with mobility-related injuries.1

Where Can You Earn the Most as a Physical Therapist in the U.S.?
For many, it’s not just about possible places of employment for a physical therapist. Pay and opportunities for advancement matter, too. Where can physical therapists work and enjoy high-paying professional development opportunities? While there is some overlap with the above lists (hello, California), there are other places of employment for physical therapists that provide a significantly higher average annual salary.
The top five states by average annual salary are:2
- California: $114,270
- Nevada: $111,460
- Alaska: $110,830
- New Jersey: $109,280
- Texas: $106,960
Top-paying metropolitan places of employment for physical therapists include:2
- San Jose-Sunnyvale-Santa Clara, CA: $136,400
- San Francisco-Oakland-Hayward, CA: $129,720
- Sacramento-Roseville-Arden-Arcade, CA: $126,200
- Vallejo-Fairfield, CA: $124,360
- Santa Rosa, CA: $122,960
- Merced, CA: $121,440
- Santa Maria-Santa Barbara, CA: $117,500
- El Centro, CA: $117,140
- Carson City, NV: $116,070
- Modesto, CA: $115,370
Finally, if you’re interested in nonmetropolitan places of employment for physical therapists, the highest average annual salaries are found in:2
- North Coast Region of California: $125,920
- Eastern Sierra-Mother Lode Region of California: $117,560
- Alaska: $115,940
- Southeast Minnesota: $113,150
- Central Louisiana: $112,930
If you’re curious about the highest-paid physical therapy role, learn more about the highest-paying physical therapy specialties to discover which career path is the most financially promising.
Include Cost of Living for True Salary Value
Pretty cut and dried, right? It’s time to pack up and head for California.
Not so fast. Looking at salary alone doesn’t reveal your true potential wealth in a given location. The cost of living varies widely based on the city and state and if you’re in an urban, suburban or rural area. Your location will impact the following:
- Monthly housing and property costs
- Grocery, clothing and household goods prices
- Utilities (rate as well as type and usage)
- Tax amounts at all levels—sales, property, state income, etc.
Let’s compare two of the above places of employment for physical therapists.
Sunnyvale, California – How can you go wrong with a name like Sunnyvale? The city is in a beautiful part of the southern San Francisco Bay Area. As a Sunnyvale-area PT, you’ll treat Silicon Valley entrepreneurs and enjoy one of the highest average salaries.
- Average annual salary: $136,4002
- Cost of living: 131% higher than the national average4
- Median home price: $1,761,6004
Carson City, Nevada – Located in the foothills of the Sierra Nevada Mountains, Carson City boasts beautiful scenery and outdoor activities. With top-rated schools and a wealth to do and see, Carson City is 15 miles east of South Lake Tahoe, California.
- Average annual salary: $116,0702
- Cost of living: 4% higher than the national average4
- Median home price: $419,5004

Where Do Physical Therapists Work Based on Their Practice Type?
Wondering, “Where can physical therapists work?” Consider both location and work environment. Potential jobs you can get with a physical therapy degree include:6
- Exercise physiologist
- Recreational therapist
- Physical therapy consultant
- Geriatric physical therapist
- Orthopedic physical therapist
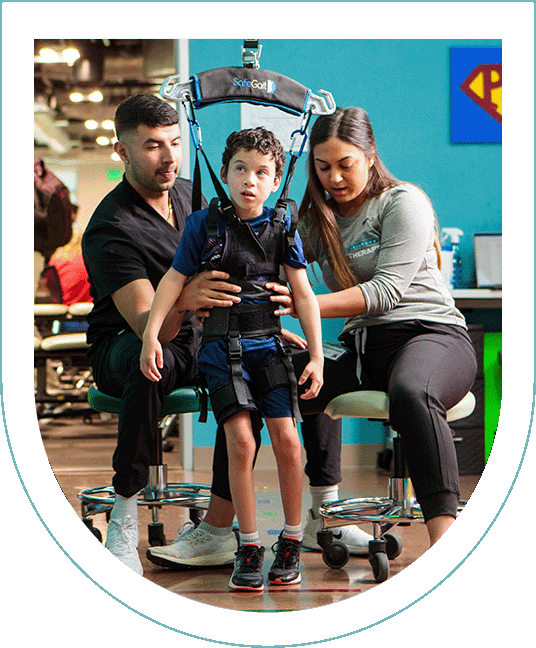
- Pediatric physical therapist
- Neurological physical therapist
Which Types of Practice Environments Pay the Most?
The top-paying industries with the following average annual salaries are found in:2
- Outpatient care centers: $123,900
- Home health care services: $116,500
- Educational support services: $112,270
- Management of companies and enterprises: $111,950
- Individual and family services: $108,950
Take the Next Step Toward a Career in Physical Therapy
The University of St. Augustine for Health Sciences (USAHS) offers a Doctor of Physical Therapy (DPT) degree that prepares you for clinical practice, research, leadership and policymaking. Applying for a DPT program in Florida is a great start to pursuing a career as a PT, and USAHS has five campuses across Florida, California and Texas. These destination cities offer access to the beauty of coastal beaches, the stimulation of big cities, inspiration of arts and culture—or all the above. Join a group of highly motivated peers who learn under the mentorship of expert faculty-practitioners at the largest PT school in the United States.*
Select from a Residential program (blended didactic courses plus in-person weekday labs) or Flex format (online courses plus in-person weekend labs).
We’re here to answer your physical therapy-related questions, whether you’re wondering how much PT school is orwhere physical therapists can work.
Are you ready to learn more? Explore our program options or request more information on how you can further your passion for physical therapy.
*Based on total DPT degrees conferred during 2020-2022, as reported by the Integrated Postsecondary Education Data System (IPEDS). Data is captured by IPEDS through interrelated surveys conducted annually by the Department of Education’s National Center for Educational Statistics (NCES).
Salary data may not reflect starting pay for recent graduates.
Sources:
- U.S. Bureau of Labor Statistics, “Physical Therapists: Summary,” BLS, August 29, 2024,https://www.bls.gov/ooh/healthcare/physical-therapists.htm.
- U.S. Bureau of Labor Statistics, “29-1123 Physical Therapist,” BLS, April 3, 2024,https://www.bls.gov/oes/current/oes291123.htm.
- “ACL Releases 2023 Profile of Older Americans,” Administration for Community Living, May 29, 2024,https://acl.gov/news-and-events/announcements/acl-releases-2023-profile-older-americans.
- Best Places, “Sunnyvale, California,” Best Places, 2025, https://www.bestplaces.net/city/california/sunnyvale.
- Best Places, “Carson City, Nevada,” Best Places, 2025, https://www.bestplaces.net/city/nevada/carson_city.
- Indeed Editorial Team, “11 Types of Physical Therapy Jobs in the Medical Field,” Indeed Career Guide, January 14, 2025, https://www.indeed.com/career-advice/finding-a-job/types-of-physical-therapy-jobs.